How many solar panels can you fit on 10 Downing Street?
-
Matt


How many solar panels can you fit on 10 Downing Street?
No, this isn’t a guess the number of pennies in a jar, school fete question! Figuring out how many panels are right for your roof is a question on many eco-conscious people’s minds. Many Solar providers will give you an estimate after a series of eligibility questions, roof shade, north or south facing; in the end it’s most likely you’ll need a technician visit before you can get an accurate view of installation cost and expected output. From a business’s perspective, this could also be a hurdle that causes many potential customers to drop out of the purchase journey. What if there was something better? Something using satellite data.
Well enter Google’s new Solar Api. Previously named Project Sunroof, this REST API can provide a detailed estimate of your roof’s solar capacity. How big each one could be, where to put them and how much power output you can expect to generate.
Naturally, we were eager to get our hands on this and see what it could do, so I thought it might be a fun exercise to see how much juice we could get out of, say… 10 Downing Street.
With its recent publication, anyone with a GCP account - or Google Maps key - can obtain Google’s “Building Insight” data about their home, even <current PM>.
Provide a value for latitude and longitude, and you’ll get access to a series of satellite images of your roof with a planned solar panel configuration to boot.
First Google uses DSM elevation data to identify a roof and associate it with an address. Combining this “Roof Mask” with annual light flux data, they can easily calculate the amount of sunlight hitting your roof, hourly, monthly, and annually.
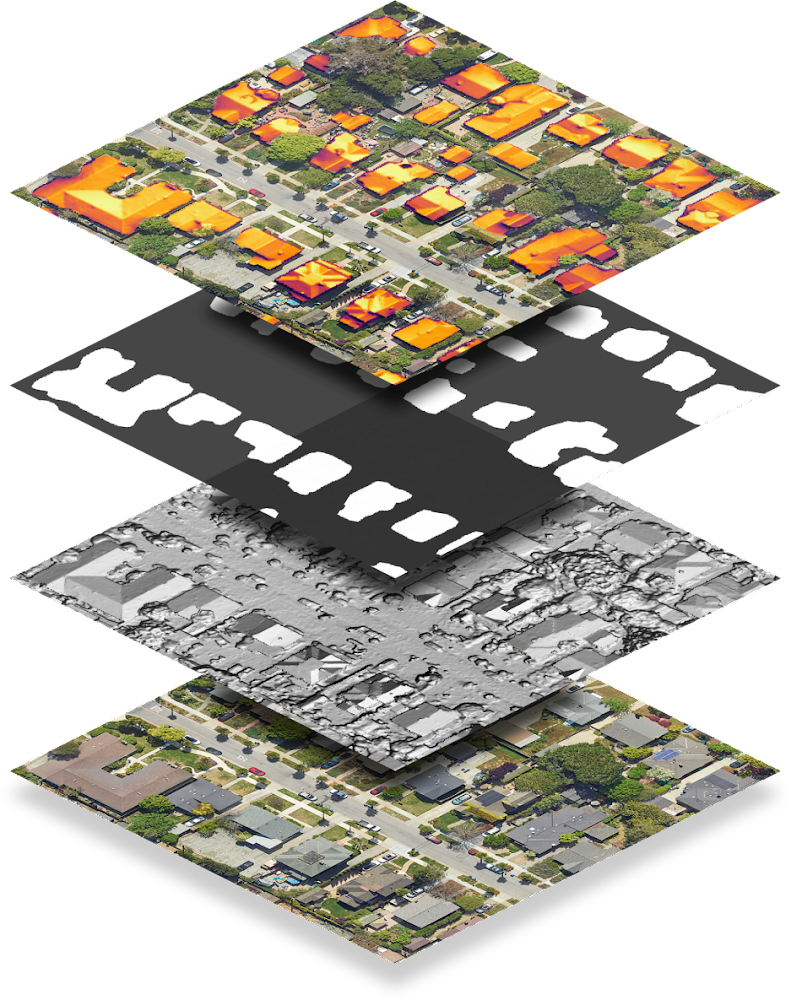
Image credit, google
From here you’ve got enough data to see, given a certain type of solar panel, how much energy you could generate from that row of terracotta tiles keeping you dry.
The REST API has two endpoints, dataLayers and buildingInsights. Querying the Data layers API returns a set of URLs for a given latitude and longitude, which we can use to download each satellite image. Whereas the Building Insights API can give us more information about our solar potential (more on that later).
Each image is returned as a GeoTiff, which combines pixels and geo-location metadata. Querying for a given latitude and longitude we get the following,
Let’s request a set of Data Layers with the following values.
51.5034011, -0.1276289


Looking at the images we can see segments of the roof at 10 Downing Street that get more sunlight (annual flux), namely the south-facing roof segments. We can also see an accurate mask for the building, which has been obtained from the DSM height data. (We will see later that the Google API can also recommend where best to put your panels given this flux data).
The Solar REST API also returns a set of “Building Insights”, estimating how many panels you could fit on your roof and how much power you could expect to generate from them.
The data returned is in the format of SolarPanelConfigs (keyed by segmentIndex) and a list of SolarPanels. Each SolarPanel data point contains a latitude and longitude value, which means we can plot them!
Looking at example data for 10 Downing Street, we can see that the solar capacity is a whopping 587 panels! And that it can produce up to 108,011.32 DCkwh per year.
{
  ...
   "solarPotential": {
    "maxArrayPanelsCount": 587,
    "maxArrayAreaMeters2": 960.8016,
    "maxSunshineHoursPerYear": 971.6158,
    "carbonOffsetFactorKgPerMwh": 478.99942,
    "roofSegmentStats": [...],
    "solarPanelConfigs" : [
      {
               "panelsCount": 4,
                "yearlyEnergyDcKwh": 980.7767,
                "roofSegmentSummaries": [...],
      }
      ...
    ],
     "solarPanels": [
        {
           "center" : {"latitude": 51.5036249, "longitude": -0.1274529},
          "orientation" : "PORTRAIT",
          "segmentIndex" : 2,
          "yearlyEnergyDcKwh" : 247.35973
        },
        ...
     ],
     ...
  }
}
We can use the Google Maps javascript API to display each panel on top of the satellite image and create an overlay for each panel data point. Given the latitude and longitude values and an SVG path, we then iterate over the solar panels and plot them using a simple overlay. The first SolarPanelConfig data point recommends a configuration of 4 panels, so let’s start there.
Each configuration references a Roof Segment that can house any number of panels, we just need to pick which ones. For this exercise, we decided to find the panels in each segment that produced the most power. A simple sort by yearlyEnergyDcKwh will do the trick.
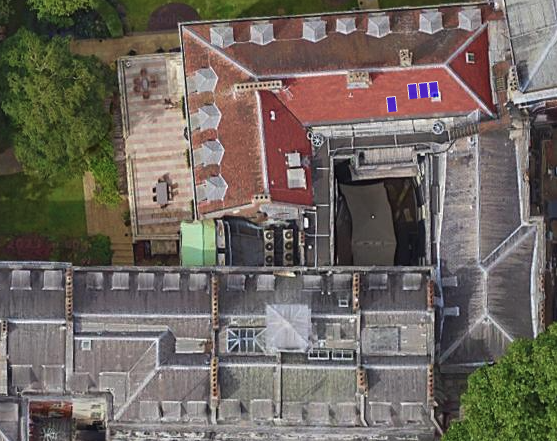
4 Panels in the sunny-est part of the roof, nice (see flux image above).
Next lets try a few more.
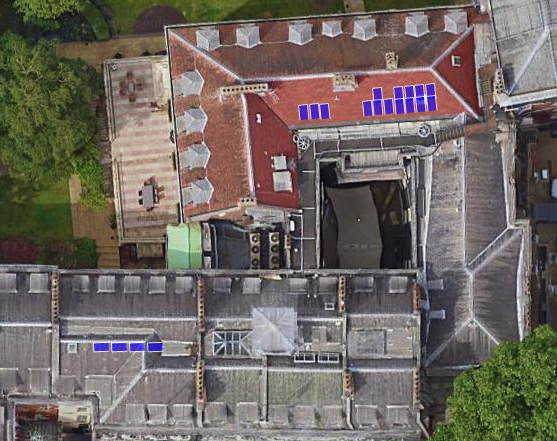
Going up to 19 panels we can see that there are a few now being placed on another sunny segment of the roof, both segments being south-facing (understandable given the flux data).
Now let’s max out the roof and see what it looks like
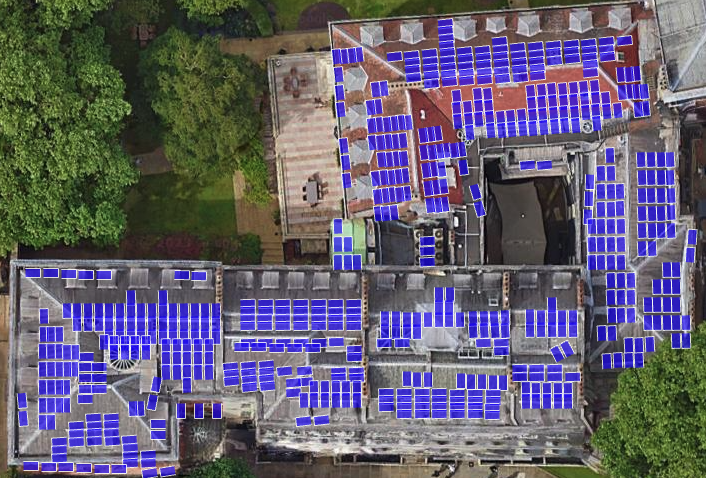
That’s a lot of panels! And if we estimate a kwH at 30p then the building could potentially save £32,000 per year.
Which is enough to… (political comment removed).
This API most certainly has the potential to make estimating solar installations a hell of a lot easier. All the data and images above were generated in a web browser, meaning this solution could be easily added to an existing E-Commerce journey. Being able to give a customer a solar estimate without having to wait for an Engineer site visit is a most definite win! And given the site survey costs, if an engineer didn’t need to visit at all, it would be more money back to the customer!
If you are interested in leveraging this API please get in touch!
Let’s do something great